Kaggle 버섯 데이터의 분류를 머신러닝으로 수행한 프로젝트입니다. 7개의 모델 Logistic Regression, Decision Tree, Random Forest, XGBoost, LightGBM, KNN, SVC 을 사용했습니다. 독성인지 아닌지 구별하는 이진 분류 문제이며, X 변수는 모두 범주형 변수로 이루어져있습니다. Kaggle 사이트에 많은 notebook이 올라와있어서 머신러닝 공부 시 수행해보기 좋습니다.

import numpy as np
import pandas as pd

import matplotlib.pyplot as plt
import seaborn as sns

mush = pd.read_csv('mushrooms.csv')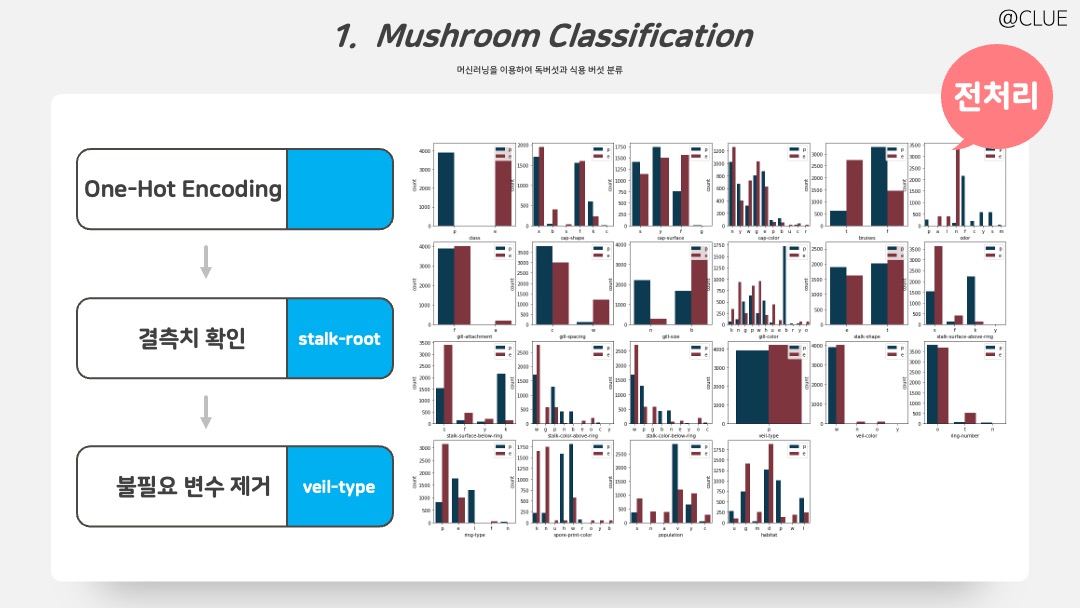
결측치를 확인하고, 결측 비율이 30%에 가까운 ‘stalk-root’ 변수를 제거했다. 또한 단일 카테고리인 ‘veil-type’ 변수 또한 제거했다.
mush.isnull().sum() # 결측치 확인
del mush['stalk-root'] # 변수 삭제

# EDA
from matplotlib.gridspec import GridSpec

fig = plt.figure(figsize = (22,15))
gs = GridSpec(nrows=4, ncols=6)
bar_width = 0.35
alpha = 0.5

for i in range(4):
    for j in range(6):
        k = i*6 + j
        if (k >= 22):
            break;
        # globals()['ax{}'.format(i)] = fig.add_subplot(gs[i, j])
        ax = fig.add_subplot(gs[i, j])
        sns.countplot(x=mush.columns[k], hue="class", data=mush, palette =['#003f5c', '#8A2935'], ax=ax)
        ax.legend(labels=mush['class'].unique(), loc="upper right")

del mush['veil-type'] # 변수 삭제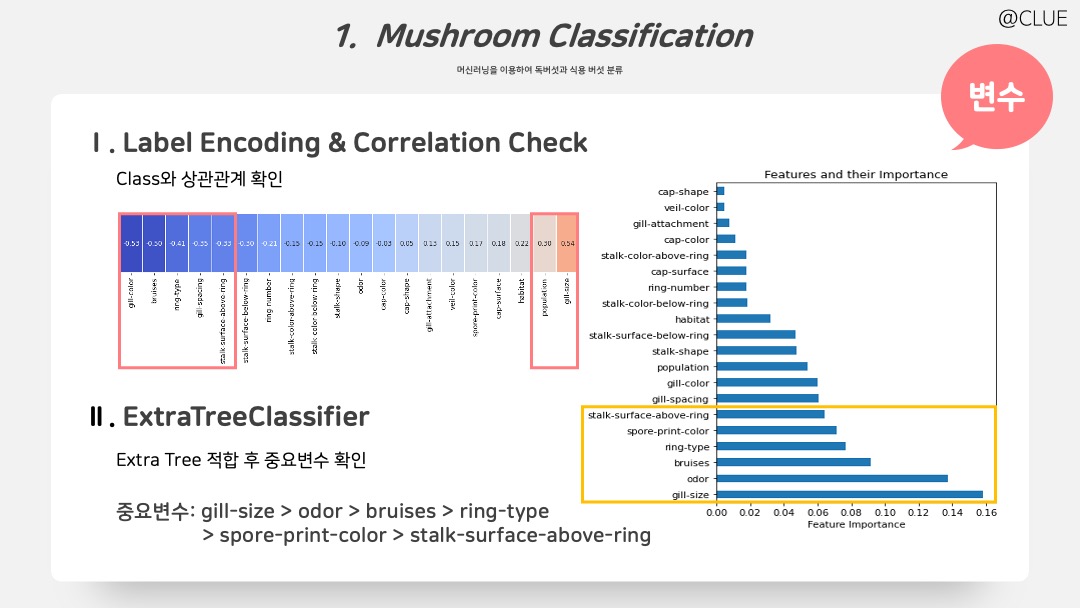
여기서 중요 변수를 탐색해보기 위해 두 가지 방법을 사용했다. 두 방법이 최선이라고 것은 아니며 그냥 이런 방법도 가능하다는 것!
- ① Y와 상관관계를 확인한다. 이때, 모든 X 변수는 범주형이지만, 변수 간 상관성을 짐작해보기 위해서 Label Encoder를 이용해 숫자값을 가지도록 변환하고 상관계수로 선형 관계성을 확인해본다.
- ② Extra Tree 적합 후 중요변수를 그려보았다.
# ① Label Encoding 후 Y와 상관계수 확인
from sklearn.preprocessing import LabelEncoder

def create_list_of_encoded_values(df):

    le = LabelEncoder()
    d_list = []

    for col in df.columns:
        le.fit(df[col])
        d_list.append(dict(zip(le.classes_, le.transform(le.classes_))))

    return d_list

def encode_datasets(d_list, df):
    i=0
    for col in df.columns:
        df[col].replace(d_list[i], inplace=True)
        i+=1

    return df

list_encoded_values = create_list_of_encoded_values(mush)
mush_lenc = encode_datasets(list_encoded_values, mush)
corr1 = mush_lenc.corr()['class'].sort_values()

plt.figure(figsize=(20,2))
sns.heatmap(data = pd.DataFrame(corr1).T, annot=True, annot_kws={"size": 12}, fmt = '.2f', linewidths=0.5, cmap='coolwarm') # .T
plt.title('Correlation with Class Variable', fontsize=20)
plt.yticks(rotation=90)
plt.tick_params(axis="x", labelsize=13)
plt.tick_params(axis="y", labelsize=16)
plt.show()
# ② Extra Tree Importance Plot
from sklearn.ensemble import ExtraTreesClassifier
plt.figure(figsize=(5,7))
et_clf = ExtraTreesClassifier(random_state=42)
et_clf.fit(mush_lenc.drop('class', axis=1), mush_lenc['class'])
pd.Series(et_clf.feature_importances_, index=mush_lenc.drop('class', axis=1).columns).nlargest(22).plot(kind='barh')
plt.xlabel('Feature Importance')
plt.title('Features and their Importance')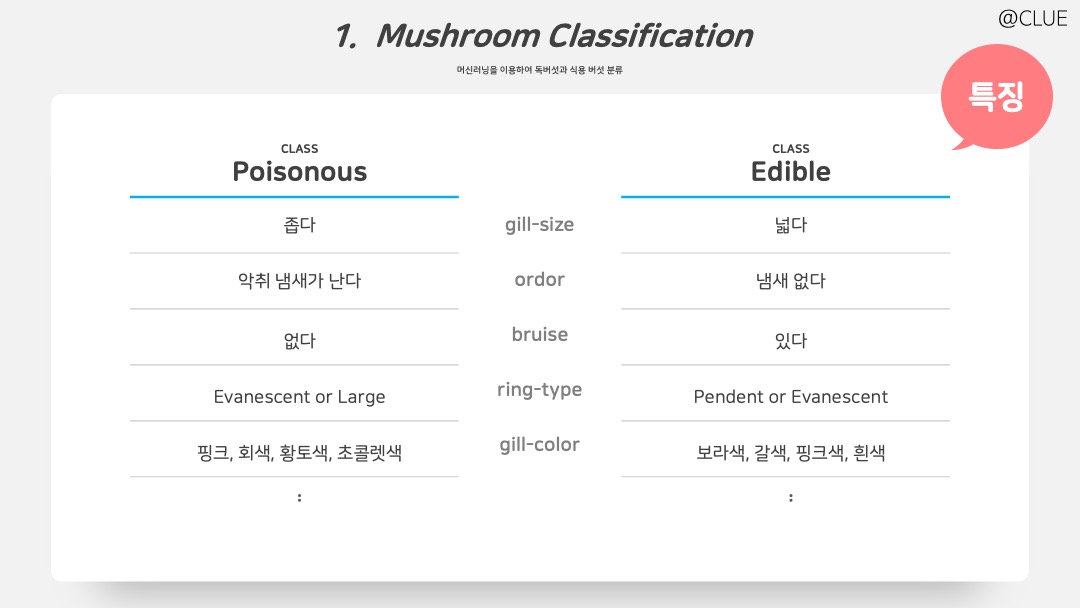
EDA와 상관계수 등을 살펴보며 얻게된 Y에 따른 특징을 표로 정리한 결과다. 표에 나타난 것과 마찬가지로 독버섯은 식용버섯과 달리 주름 크기가 좁고 악취 냄새가 나며 멍이 없고 회색, 황토색, 초콜렛색을 띄는 경우가 많다는 것을 알 수 있다.
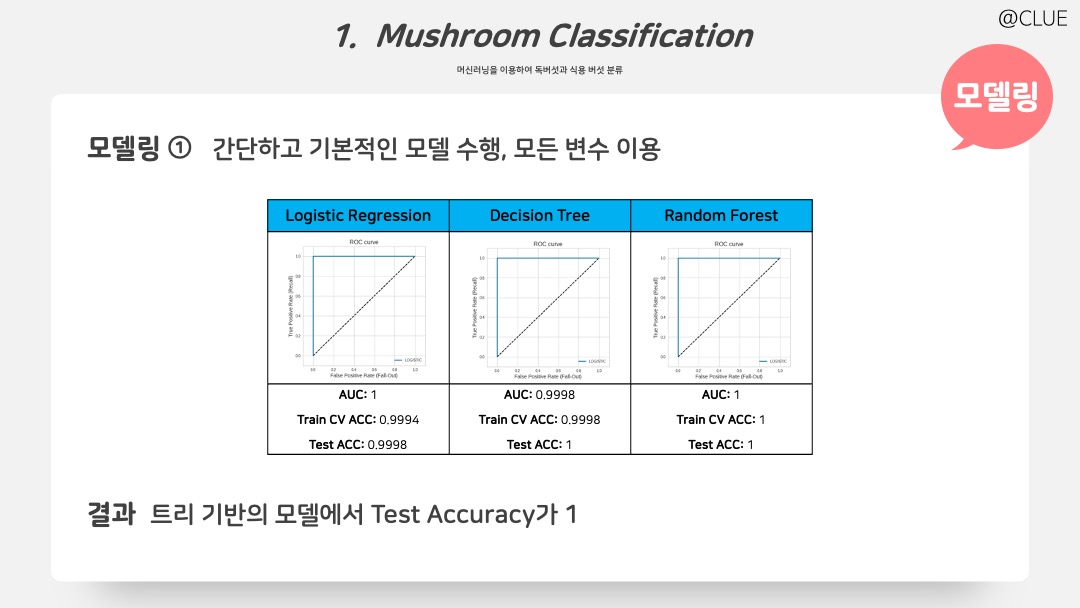
훈련 셋의 비율을 80%로 모델을 적합했다. 모두 5-fold CV Accuracy와 Test Accuracy로 비교를 진행하고, 먼저 간단하고 기본적인 Logistic, Decision Tree, Random Forest를 적합한 결과, 트리 기반의 모델이 굉장히 잘 적합됨을 확인할 수 있다.
그 전에 먼저 평가 기준을 위한 함수 작성 코드이다. 다음과 같이 CV_check(), plt_roc_curve(), ROC_check(), error_result_check() 함수를 커스터마이징하여 사용해보았다.
import numpy as np
from sklearn.model_selection import train_test_split

X_train, X_test, y_train, y_test = train_test_split(X, y, test_size=0.2, random_state=2)

# 필요한 라이브러리 및 함수 import
from sklearn.model_selection import cross_validate
from sklearn.metrics import roc_curve, roc_auc_score
from sklearn.model_selection import cross_val_predict
from sklearn.metrics import confusion_matrix
from sklearn.metrics import accuracy_score

# Train CV 결과
def CV_check(model, X, Y):
    CV_df = pd.DataFrame(cross_validate(model, X, Y, scoring=scoring, cv=5))
    CV_df = CV_df.iloc[:,2:]
    CV_df.columns = scoring

    print('[Train] \n')
    print("5-fold CV Clasification report:\n")
    print(CV_df,"\n\n")
    print("Mean Scores:\n")
    for score in scoring:
        print(f"\t{score}: {round(CV_df[score].mean(),4)}")

# Train Data CV 결과 이용한 ROC
def plt_roc_curve(fpr, tpr, label):
    plt.plot(fpr, tpr, linewidth=2, label=label)
    plt.xlabel('False Positive Rate (Fall-Out)', fontsize=14)
    plt.ylabel('True Positive Rate (Recall)', fontsize=14)

def ROC_check(model, X, Y):
    # y_scores = model.predict_proba(X)
    y_scores = cross_val_predict(model, X, Y, cv=5, method='predict_proba')
    fpr, tpr, thresholds = roc_curve(Y, y_scores[:,1])
    auc = roc_auc_score(y_train, y_scores[:,1])

    plt.figure(figsize = (6,6))
    plt.plot([0,1], [0,1], 'k--')
    plt.axis([-.1,1.1,-.1,1.1])
    base_roc_curve(fpr,tpr, 'LOGISTIC')
    plt.legend(loc='lower right')
    plt.title('ROC curve', fontsize=16)
    plt.grid(True)
    plt.show()

    print('\nAUC: ', auc)

# Test에 사용 (CV 안함)
def error_result_check(model, X, Y):
    pred = model.predict(X)

    confu = confusion_matrix(y_true=Y, y_pred=pred)
    print('\n\n[Test] \n')
    print("Confusion Matrix: \n")
    print(confu, '\n')

    acc = accuracy_score(y_true=Y, y_pred=pred)
    print('Test Accuracy: ', round(acc,4))

scoring = ['accuracy','precision', 'recall','f1']
이 함수들을 이용하여 fitting 후 결과 확인에 사용했다.
X = mush.iloc[:,1:] # 이때 stalk-root, veil-type 변수 이미 삭제한 상태
y = mush['class']

from sklearn.preprocessing import OneHotEncoder
from sklearn.preprocessing import LabelEncoder

onehot = OneHotEncoder()
onehot.fit(X)
X = onehot.transform(X).toarray()

labenc = LabelEncoder()
y = labenc.fit_transform(y)
 # 0-edible, 1-poisnous

# Logistic Regression
from sklearn.linear_model import LogisticRegression

logis = LogisticRegression()
logis.fit(X_train, y_train)

CV_check(logis, X_train, y_train)
ROC_check(logis, X_train, y_train)
error_result_check(logis, X_train, y_train)

# Decision Tree
from sklearn.tree import DecisionTreeClassifier

dt = DecisionTreeClassifier()
dt.fit(X_train, y_train)

CV_check(dt, X_train, y_train)
ROC_check(dt, X_train, y_train)
error_result_check(dt, X_train, y_train)

# Random Forest
from sklearn.ensemble import RandomForestClassifier

rf = RandomForestClassifier()
rf.fit(X_train, y_train)

CV_check(rf, X_train, y_train)
ROC_check(rf, X_train, y_train)
error_result_check(rf, X_train, y_train)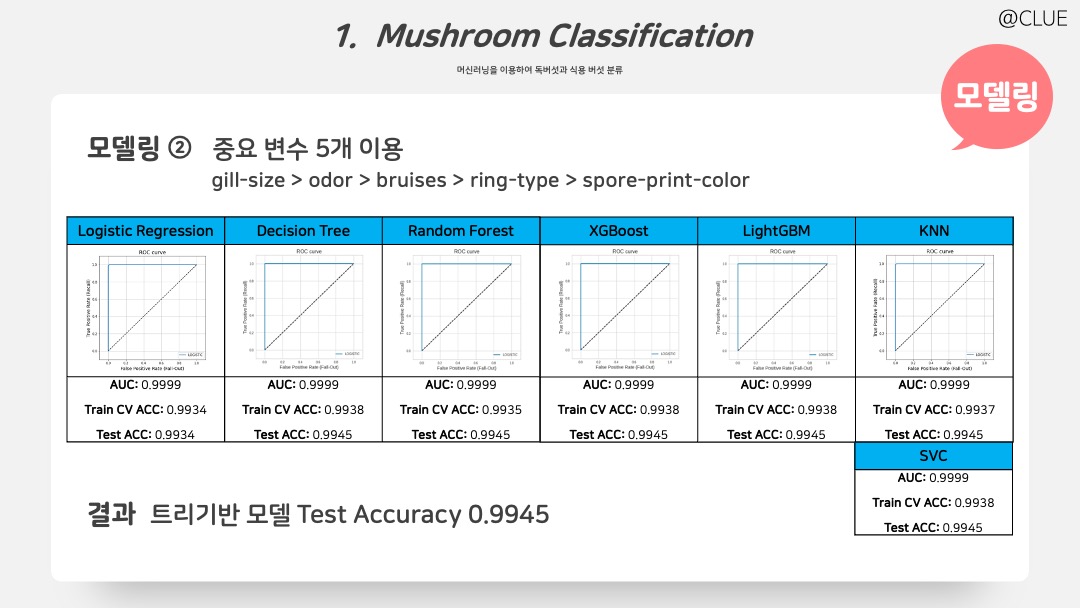
앞에서 매우 높은 정확도를 보였기 때문에, 계산량을 줄이고 모델을 간결하게 만들어보고자 축차적으로 줄였다. 그 결과, 5개 gill-size, ordor, bruises, ring-type, spore-print-color 변수로 충분히 잘 적합됨을 확인할 수 있다. 사용한 모델은 Logistic Regression, Decision Tree, Random Forest, XGBoost, LightGBM, KNN, SVC이며, 이 7개 모델 비교한 결과이다.
# 최종 전처리 코드
mush = pd.read_csv('mushrooms.csv')

# 변수 추가 및 삭제
def var_del(mush):
    del_col = ["stalk-root", "veil-type"]
    mush.drop(del_col, axis=1, inplace=True)

    return mush

# 변수 선택
def var_select(mush):
    # 'habitat', 'stalk-surface-below-ring', 'stalk-shape',
    cols = ['class',  'population', 'gill-color', 'gill-spacing', 'stalk-surface-above-ring', 'spore-print-color','ring-type', 'bruises', 'odor', 'gill-size']
    mush = mush[cols]

    return mush

# 데이터셋 전처리 한번에 수행
def transform_features(mush):
    mush = var_del(mush)
    mush = var_select(mush)
    return mush
mush = transform_features(mush)

# X, Y 나누고, 인코딩 후 train, test 나누는 코드는 바로 위 코드와 동일하게 진행

# 모델링 코드 (Logistic, Decision Tree, Random Forest 위와 같아서 코드는 생략)

# XGBoost
from xgboost import XGBClassifier

xgb = XGBClassifier()
xgb.fit(X_train, y_train)

CV_check(xgb, X_train, y_train)
ROC_check(xgb, X_train, y_train)
error_result_check(xgb, X_train, y_train)

# LightGBM
from lightgbm import LGBMClassifier

lgbm = LGBMClassifier()
lgbm.fit(X_train, y_train)

CV_check(lgbm, X_train, y_train)
ROC_check(lgbm, X_train, y_train)
error_result_check(lgbm, X_train, y_train)

# SVC (Support Vector Classifier)
from sklearn.svm import SVC

svc = SVC(kernel = 'linear')
svc.fit(X_train, y_train)

CV_check(svc, X_train, y_train)
# ROC_check(svc, X_train, y_train): no predict_proba, no ROC curve
error_result_check(svc, X_train, y_train)

# KNN
from sklearn.neighbors import KNeighborsClassifier

knn = KNeighborsClassifier()
knn.fit(X_train, y_train)

CV_check(knn, X_train, y_train)
ROC_check(knn, X_train, y_train)
error_result_check(knn, X_train, y_train)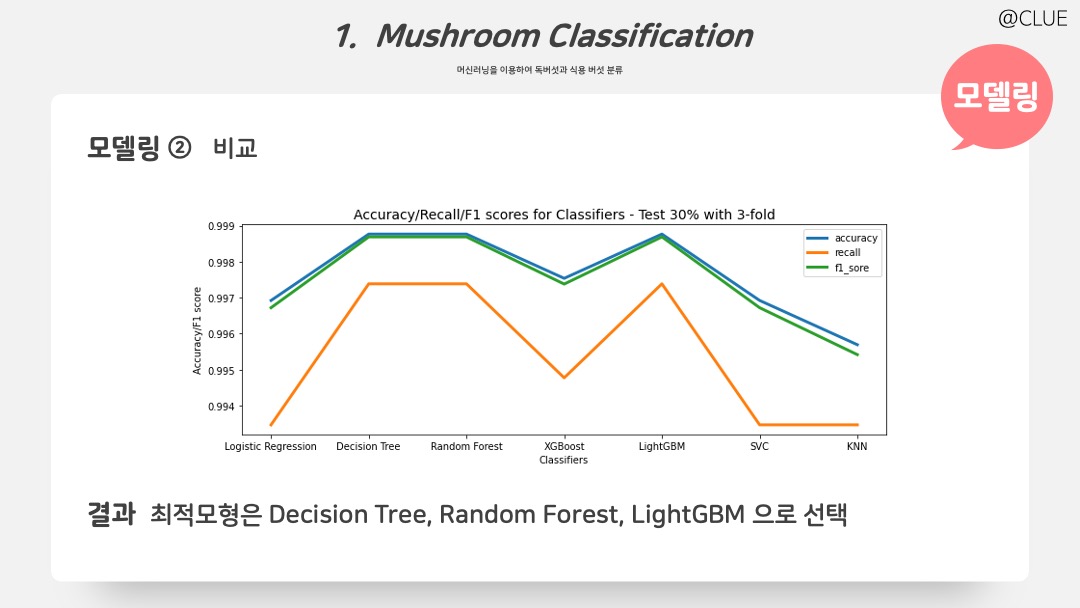
각 모델의 Accuracy, F1-socre, Recall을 test 셋에서 비교해본 결과이다. Decision Tree, Random Forest, LightGBM의 성능이 우수한 것을 확인할 수 있으며, 트리 기반에 세 모델을 (내 마음속의 ㅋㅋ) 최적 모형으로 선택했다.
from sklearn.metrics import f1_score, accuracy_score, recall_score
from sklearn.model_selection import cross_val_predict

def compare_scores(X, Y):
    models = [logis, dt, rf, xgb, lgbm, svc, knn]
    accuracy_scores = []
    recall_scores = []
    f1_scores = []

    for clf in models:
        y_pred = cross_val_predict(clf, X, Y, cv=5)
        accuracy_scores.append(accuracy_score(Y, y_pred))
        recall_scores.append(recall_score(Y, y_pred))
        f1_scores.append(f1_score(Y, y_pred))

    return accuracy_scores, recall_scores, f1_scores

tr_acc, tr_rcl, tr_f1 = compare_scores(X_train, y_train)
te_acc, te_rcl, te_f1 = compare_scores(X_test, y_test)

plt.figure(figsize=(12,5))

mylist = ['Logistic Regression', 'Decision Tree', 'Random Forest', 'XGBoost', 'LightGBM', 'SVC', 'KNN']

sns.lineplot(x=mylist, y=tr_acc, linewidth=3, label='accuracy')
sns.lineplot(x=mylist, y=tr_rcl, linewidth=3, label='recall')
sns.lineplot(x=mylist, y=tr_f1, linewidth=3, label='f1_sore')

plt.title('Accuracy/Recall/F1 scores for Classifiers - Train 70% with 5-fold', fontsize=14)
plt.xlabel('Classifiers')
plt.ylabel('Accuracy/F1 score')

plt.legend(loc='upper right')
피피티 디자인 저작권은 @PPTBIZCAM
